

A Clear, Trusted Way to Measure Inventory Performance Across Every Site
Stop relying on ambiguous balance-sheet numbers. Use a consistent formula to compare real inventory performance—past, present, and forecasted.
A Working-Capital Dashboard in a Single View
Finance owns the inventory numbers. But without a consistent way to measure performance, teams struggle to understand which sites manage working capital well and which don’t.
The Inventory Turns Calculator gives you:
- 13-point inventory turns based on the last 12 months of COGS and 13 months of ending inventory—your most reliable view of year-round performance.
- Spot turns for quick checks on short-term inventory performance.
- Automated PivotTables and PivotCharts for visualizing trends and site-by-site comparisons.
- A built-in executive summary tab for year-over-year comparison you can drop straight into a leadership deck.
No macros. No complex setup. Just plug in your data and get answers.
Download the Inventory Turns Calculator
A ready-to-use Excel model for accurate working-capital visibility.
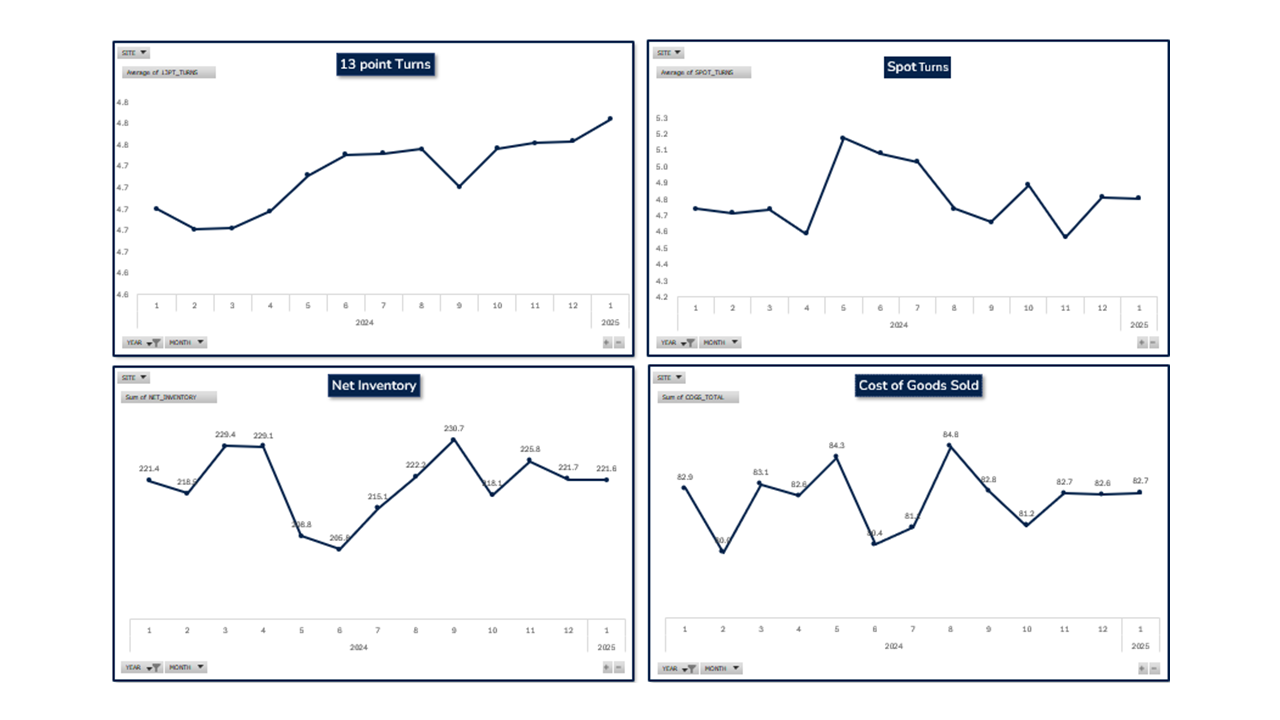
Working Capital Depends on Consistent Inventory Metrics
When every site tracks performance differently, you can’t see who is managing cash well—and who isn’t.
Finance provides the numbers. But without a standard metric, “inventory performance” becomes guesswork.
Net inventory alone doesn’t tell you anything about efficiency, velocity, or cash discipline.
Inventory Turns do. But only if they’re calculated the same way across the business.
This calculator removes the ambiguity—then lets you model future planning scenarios before taking optimization down to the SKU level with Nvexus.
What You’ll Learn
Why Inventory Metrics Break Down Across the Organization
You can’t manage working capital with inconsistent methods.
The numbers may come from Finance, but the way they’re measured varies everywhere:
- One site presents gross inventory
- Another uses its own “turns” calculation
- Others use net inventory balance-sheet values with no performance context
None of those tell you whether inventory is being managed well.
Without a unified metric:
- Cash flow conversations drift
- Operational reviews misalign
- Improvement efforts can’t be compared
Inventory Turns are the industry standard for measuring inventory performance.
This calculator standardizes the formula so every site speaks the same language.
What 13-Point Turns Reveal About Long-Term Performance
The most trusted view of how efficiently inventory was managed all year.
13-point inventory turns smooth out swings, seasonal patterns, and short-term anomalies.
They reveal true year-round performance and are the most consistent working-capital metric used across industries.
This calculator:
- Applies the same 13-point method to every site
- Charts performance over time
- Makes year-over-year comparisons effortless
With one metric, teams finally get a stable lens for evaluating long-term inventory efficiency.
How Spot Turns Expose Short-Term Momentum
A quick pulse check on how the site is trending right now.
While 13-point turns show the long-term story, spot turns show what’s happening this quarter:
- Cleanup efforts
- Inventory discipline
- Operational momentum
- Quarter-end performance signals
Spot turns aren’t the full story—but they’re important signals.
The calculator shows both metrics side by side so teams can see immediate movement without losing long-term context.
How Scenario Planning Changes the Conversation
Plan next year before it starts. Then measure if reality matched the plan.
Most tools only measure hindsight.
This one lets you project forward:
- Actuals → Based on closed financials
- Budget → Based on forecasted COGS and inventory
- Variance → Where expectations and performance diverge
Using the companion Inventory Forecasting – Input Output Model, teams can forecast:
- Monthly expected COGS
- Expected ending inventory balances
- Anticipated turns for the next fiscal year
You can run “What if?” scenarios to test:
- Expected turn performance under different sales outlooks
- Impact of planned operational changes
- Whether the budget aligns with working-capital goals
This aligns finance, operations, and supply chain around one future-facing inventory metric.
Where the Spreadsheet Stops and Nvexus Takes Over
The calculator aligns the conversation. Nvexus fixes the underlying drivers.
The Excel calculator aligns your sites on:
- A single inventory-turns methodology
- Long-term and short-term performance
- Budget vs. Actuals
- Year-over-year improvement trends
But inventory turns are an outcome, not a lever.
To improve them, you must address the behaviors and policies behind the number.
That’s where Nvexus comes in.
SKU-Level Inventory Insight
Nvexus doesn’t try to measure site-level turns. Instead, it computes turns at the SKU level to reveal:
- Slow-moving parts
- High-velocity SKUs at risk
- Parts holding excess cash
ABC/XYZ Segmentation + Action Playbooks
Every SKU is classified, and the platform recommends targeted actions based on value and variability—tightening lot sizes, tuning reorder points, right-sizing safety stock.
Inventory Burndown Model
Nvexus projects future inventory for each part using supply, demand, and on-hand balances.
You see exactly when parts will become excess or reach shortage.
Together, the calculator + Nvexus provide site visibility and SKU-level actionability.
FAQs
Why isn’t net inventory enough to measure performance?
Net inventory shows what you have—not how efficiently you manage it.
Inventory turns reflect cash velocity and operational performance, which is why turns are the industry-standard metric.
What are 13-point inventory turns?
A consistent, year-round metric showing how efficiently a site manages inventory over time.
What are spot turns?
A short-term metric that highlights quarter-end discipline and momentum.
Can this calculator compare Actuals vs. Budget?
Yes. You can enter both scenarios to compare expected vs. actual performance.
Along with using the Inventory Forecasting – Input Output Model, you can forecast COGS and inventory for the year ahead and simulate inventory-turn performance.
Does finance still own the COGS and inventory data?
Yes. This tool doesn’t change how numbers are produced—only how they are measured.
What alternate inventory metrics exist?
Metrics like Days of Inventory (DOI), Days of Sales Inventory (DSI), and Normalized Inventory as a % of Revenue offer additional context but are optional.
Inventory turns remain the cleanest industry-standard measure of performance.
How does Nvexus help beyond the calculator?
Nvexus analyzes inventory performance by SKU, not just by site.
It identifies slow movers, fast movers, policy issues, and future inventory imbalance through ABC/XYZ classifications and the Inventory Burndown model.