

See How Mature Your ERP Really Is — and What It’s Costing You
A practical assessment that reveals where your ERP supports the business… and where broken processes, missing data, and manual workarounds are slowing everything down.
A Clear Path to Improve ERP Performance Across Every Function
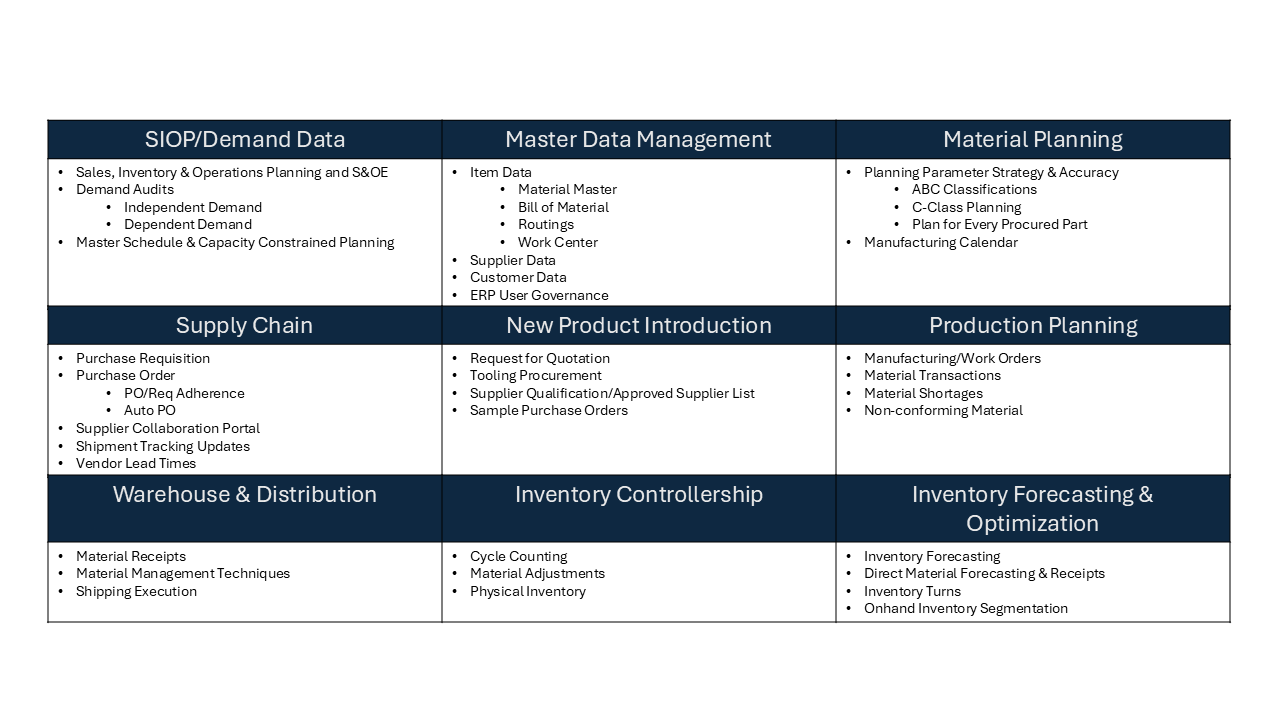
This ERP Maturity Model assessment shows you how well your organization uses its ERP system across demand planning, master data, material planning, supply chain, NPI, production, warehousing, and inventory control.
You’ll see your current stage (Developing → Leading), where gaps exist, and what to fix first.
- Understand your true ERP maturity
- Identify gaps slowing down planning, procurement, and production
- Highlights where you’re over-relying on spreadsheets and tribal knowledge
- Know exactly what to improve next
Download the Assessment
Get a complete ERP maturity score across nine core material processes — with a roadmap for what “good” looks like and how to get there.
Your ERP Is Running. But Is Your Business Actually Using It?
Most companies have already invested in an ERP system. The problem isn’t the software—it’s how unevenly it’s used. Some teams run their entire day-to-day operations from the system. Others live in spreadsheets and email.
This assessment helps you measure ERP maturity across your materials processes and connect those results to real business outcomes: higher service levels, healthier working capital, and reduced costs.
What You’ll Learn
- Why ERP Maturity Matters More Than “We Went Live”
- What’s Inside the ERP Maturity Assessment
- From Developing to Leading: A Clear Scale for ERP Usage
- The Pillars of ERP-Driven Materials Performance
- Turn Your ERP Maturity Score Into a Roadmap
- From Assessment to Automation: How Nvexus Makes ERP Maturity Stick
Why ERP Maturity Matters More Than “We Went Live”
An ERP that isn’t fully used behaves like an expensive spreadsheet.
Most teams declare victory when the ERP goes live. But the real question is simpler: How much of your daily work actually runs through the system?
When planning, purchasing, and production rely on side Excel files, manual overrides, and email-driven workflows, you end up with:
- Demand in the ERP system that doesn’t match reality
- Master data that drifts and quietly breaks planning
- Purchase orders, work orders, and inventory that no longer tell the same story
The result: missed deliveries, bloated stock, and planners chasing fires instead of managing the plan.
The ERP Maturity Assessment shows where this is happening across your materials processes—and what it would look like if the system became the single source of truth again.
What’s Inside the ERP Maturity Assessment
Nine core materials workflows. One simple model to score them all.
The assessment is a structured Excel model that walks your team through nine major materials functions and how they use ERP today:
- SIOP & Demand: How well demand planning, SIOP, and master scheduling live in ERP (not just in slide decks).
- Master Data Management: How complete and accurate your item, cost, vendor, and customer records are—and how often they’re maintained.
- Material Planning: Whether each part has a clear strategy (PFEP, ABC, C-class rules) that the system actually enforces.
- Supply Chain Execution: How cleanly requisitions become POs, how well sourcing rules work, and how tightly you manage vendor lead times and prom
- New Product Introduction: How early your ERP systems and Supply Chain processes are connected to new designs, tooling, and supplier qualification.
- Production Planning: How disciplined your work orders, lead times, and material transactions are on the shop floor.
- Warehouse & Distribution: How receipts, storage, picking, and shipping are driven by system data instead of memory.
- Inventory Controllership: Whether you can trust your inventory values through cycle counts, adjustments, and physicals.
- Inventory Forecasting & Optimization: How well you forecast inventory, track turns, and tie working capital back to ERP signals.
For each area, you rate your current state from Stage 1 (Developing) to Stage 4 (Leading). The template calculates scores, highlights gaps, and shows where to focus first.
From Developing to Leading: A Clear Scale for ERP Usage
Four simple stages that tell you if your ERP is a system of record—or a system of suggestion.
The model uses a four-level scale so your team can quickly align on where you are today:
- Stage 1 – Developing: Processes exist, but live mostly in spreadsheets, email, or tribal knowledge. ERP is used for transactions, not decisions.
- Stage 2 – Emerging: Key data and processes are in ERP, but not consistently maintained. Teams work around gaps with manual fixes.
- Stage 3 – Robust: ERP reflects how the business actually runs. Data is maintained, planning runs through the system, and users trust the outputs.
- Stage 4 – Leading: ERP is the backbone of a closed-loop process. Data is audited, decisions are data-driven, and automation replaces busywork.
Each question in the assessment maps to this scale, weighted by impact. The output isn’t just a single score—it’s a maturity profile that tells you:
- Which areas are dangerously underdeveloped
- Where you’re already operating at a high level
- Which upgrades will move the needle fastest for service, cost, and working capital
The Pillars of ERP-Driven Materials Performance
From SIOP to stock accuracy, each pillar shows how well ERP supports real-world execution.
1. Planning & SIOP Alignment
Your SIOP and Sales & Operations Execution processes only work if demand is loaded in the ERP system accurately, and a realistic master schedule drives operations and supply chain to act.
The assessment looks at:
- Whether SIOP outputs flow into ERP demand and master scheduling
- How you audit independent and dependent demand for errors and duplicates
- How well capacity constraints are reflected in how you load the shop
You’ll see where your planning rhythm is strong—and where it breaks as soon as it hits the system.
2. Master Data as a Living Asset
If master data is wrong, your “plan” is just a wish.
This pillar reviews how you manage:
- Item and planning data: Planning parameters, BOMs, routings, and work centers
- Costing data: Whether costs are loaded and maintained for active items
- Supplier and customer records: Clean addresses, terms, and sourcing attributes
- ERP user governance: Who can create and change data, and how it’s controlled
You’ll see if your data backbone supports reliable planning—or quietly undermines it every day.
3. Part Strategy & Material Planning Discipline
Every part needs more than a part number—it needs a strategy.
Here, the assessment checks whether your planning rules are intentional and enforced:
- Is there a clear Plan for Every Part that covers replenishment method, lot sizing, and safety stock logic? If you want a deeper walkthrough of the core replenishment methods, see the Order Policy Playbook.
- Do you use ABC and segmentation to focus effort and apply differentiated policies?
- Are C-class parts managed with simple, low-touch strategies that protect availability and planner time? For practical methods and ERP setups, the C-Class Planning Strategy Guide breaks these approaches down.
- Is your manufacturing calendar accurate so demand and supply dates align with real working days?
- Do planning parameters actually stay in sync with how parts behave?
This pillar shows whether parts are managed like a portfolio—or treated like a flat list of SKUs.
4. Supply Chain & Supplier Performance
If requisitions, POs, and vendors aren’t aligned, your ERP can’t protect your promises.
This area looks at how cleanly you turn planned demand into inbound supply:
- How often requisitions are used and how closely POs follow them
- Whether sourcing rules, list prices, and automatic POs reduce manual buyer work
- How you manage PO changes, promise acknowledgments, and shipment visibility
- How frequently vendor lead times are reviewed and updated in ER
You’ll see if your ERP is driving a disciplined supply chain—or just recording what already happened.
5. New Product & Change Readiness
New products shouldn’t break your ERP every time they launch.
This pillar reviews how NPI flows are tied into ERP and Supply Chain:
- Are projects and proposals set up with enough structure to plan materials, tools, and capacity?
- Does Sourcing get early notifications of new designs and new component demand?
- How standardized are RFQs, supplier selection, tooling buys, sample POs, and approved supplier lists for new parts?
You’ll see whether new products slot cleanly into your existing ERP framework—or arrive as one-off exceptions every time.
6. Production Planning & Shop Floor Discipline
If work orders and material transactions are messy, your ERP view of WIP is fiction.
Here, the focus is on how tightly the shop floor and ERP stay in sync:
- How you create, name, and manage work orders across their life cycle
- Whether make lead times reflect actual performance
- How WIP supply, backflushing, and material transactions are configured and used
- How quickly you detect material shortages and non-conforming material
The assessment surfaces where production is well controlled—and where the system is always playing catch-up.
7. Warehouse, Inventory Control & Forecasting
You can’t optimize inventory you don’t trust—or can’t see.
- Warehouse execution: Receipts, put-away, subinventories, storage logic, picking, and shipping
- Inventory controllership: Cycle counting, adjustments, and physical inventory discipline
- Inventory forecasting & optimization: How you forecast inventory, track turns, connect SIOP to inventory plans, and segment on-hand stock (with supporting tools like the Inventory Turns Calculator and the Inventory Forecasting – Input Output Model).
You’ll understand if inventory values are trustworthy, if material flows are efficient, and whether your working capital strategy is backed by data—or driven by fear of stockouts.
Turn Your ERP Maturity Score Into a Roadmap
You don’t need to fix everything at once—you need to fix the right things first.
The goal of the assessment isn’t a vanity score. It’s a prioritized plan.
Once you’ve rated each area, the template:
- Highlights which pillars are furthest from Stage 4 and most critical to address
- Shows quick-win opportunities (like calendar fixes or parameter audits) versus deeper structural issues
- Helps you align leaders around a simple sequence: stabilize demand → fix master data → harden planning → tighten execution → optimize inventory
You can use the output to drive SIOP discussions, annual improvement plans, or to frame how new tools and processes will be rolled out.
From Assessment to Automation: How Nvexus Makes ERP Maturity Stick
The assessment shows you what’s broken. Nvexus monitors it every day so it stays fixed.
The ERP Maturity Assessment gives you a snapshot. Nvexus is built to give you a live feed.
Once you know where your weak spots are, Nvexus modules help you monitor, audit, and automate the same processes you just scored:
- Keep demand and SIOP honest – time-phased views of orders and forecasts so you can see if what’s in ERP matches what’s in the plan.
- Lock down master data and planning rules – continuous audits of planning parameters, BOMs, lead times, calendars, vendors, and costs so they don’t drift.
- Tighten supply chain execution – visibility from requisition to PO to supplier performance, with clear priorities for what buyers should work on first.
- Protect the shop floor – live views of open work orders, material readiness, and shortages so planners can schedule what’s truly buildable.
- Control and optimize inventory – cycle count health, on-hand inventory segmentation, forward-looking inventory and material forecasts, and part-level turns to drive burndown.
Together, these modules turn the maturity model into a live control system: you define what “good” looks like, and Nvexus watches your ERP every week to make sure you stay there.
FAQs
What is an ERP Maturity Model?
It’s a structured way to measure how well your company actually uses its ERP across key processes—not just whether the system is installed. It scores each area from basic usage to advanced, automated, and data-driven.
Who should use this ERP Maturity Assessment?
It’s built for operations, supply chain, and finance leaders who want a clear view of how demand, materials, and inventory really run today—and where ERP isn’t being used to its full potential.
How long does the assessment take to complete?
Most teams can complete a first pass in 45–90 minutes, depending on how many people you involve. You can refine scores over time as you discuss and align.
Do I need detailed data to fill it out?
You don’t need to pull reports for every question. The model is based on process behavior—how you work today, how often you maintain data, and how much you rely on ERP vs. spreadsheets.
How often should we reassess our ERP maturity?
Most teams benefit from revisiting the model once or twice a year—or after major changes, like an ERP upgrade, new site onboarding, or a big process improvement effort.
Is this the same as an ERP implementation checklist?
No. This assumes your ERP is already in place. It focuses on how deeply it’s integrated into daily planning, buying, production, and inventory work, and whether the data and processes are actually trusted.
Does this replace outside consultants?
The assessment is designed so you can self-diagnose and prioritize. You can absolutely share the results with your partners or consultants—but you won’t need them just to figure out where the problems are.
What do we do after we get our score?
Use the maturity profile to pick 2–3 focus areas for the next 6–12 months. Then use tools like Nvexus to monitor those areas and make sure improvements stick instead of fading.