

Forecast Smarter. Fix Bias. Stop the Guesswork.
Most teams measure forecast accuracy, but few measure it correctly. This guide shows the proven methods for diagnosing forecast error—and improving it.
A clear, simple guide for measuring forecast accuracy the right way
Understand the real drivers of forecast error, how to measure them, and how to use those numbers to improve planning, service levels, and inventory.
Free demand forecast accuracy calculator
A practical, easy-to-use reference on Forecast Accuracy, Forecast Bias, and more.
Why Forecast Accuracy Fails in Most Teams
Forecast accuracy isn’t about having the perfect model. It’s about using the right metrics—and knowing what the numbers actually mean.
Most teams report forecast accuracy, but the numbers hide more than they reveal. Small errors blend into averages. Big errors disappear in summaries. Bias gets ignored until inventory piles up or customers get shorted.
This calculator breaks down the formulas, shows when to use each one, and explains how to interpret forecast accuracy in a way that actually improves planning.
What You’ll Learn
The Hidden Cost of Bad Forecast Accuracy
When forecasts fail, your ERP reacts—often in the wrong direction.
Bad forecast accuracy doesn’t just distort reports—it drives real operational chaos and financial waste.
When accuracy is off, your ERP makes decisions based on the wrong signal.
- If forecasts run too high, the system buys more than you need. Inventory piles up, cash gets locked on the shelf, and turns slow down.
- If forecasts run too low, the system orders too little. Sales get missed, customers wait, and planners scramble to expedite at premium cost. The quick fix—adding more safety stock—only traps more cash in inventory
Poor forecast accuracy creates a constant trade-off: excess inventory or missed revenue, both of which erode margins and trust in the plan.
But when forecast accuracy is strong, everything improves.
Your ERP releases orders with confidence. Inventory aligns with demand instead of fighting it. Cash isn’t stuck in overstock, service levels rise, and planners spend their time improving the plan—not cleaning up after it. Lead times shorten, expediting disappears, and operations run smoother because the business is planning to reality.
This calculator shows how to measure forecast accuracy the right way, uncover hidden issues, and make sure your ERP is responding to real demand—not guesswork.
Why Forecast Bias Breaks Your Planning Process
Accuracy tells you how far off you were. Bias tells you why.
Most teams track accuracy but ignore bias—the silent force that pushes inventory and service levels in the wrong direction.
Bias shows whether your forecasts consistently overshoot or undershoot actual customer demand. And when that pattern repeats month after month, the financial impact is unavoidable.
When bias runs too high, your ERP orders inventory you don’t actually need. Cash gets tied up in components waiting for customer orders that never arrive. Inventory grows faster than demand, inventory turns drop, and working capital gets stuck on the shelf.
When bias runs too low, demand outpaces supply. Orders get shorted, sales are missed, and planners scramble to expedite. To protect against this, teams often add more safety stock—but that “insurance” locks up even more cash in inventory.
Consistent forecast bias forces a costly trade-off:
hold excess inventory or miss revenue—sometimes both.
This calculator breaks down how to measure Forecast Bias and Tracking Signal, and how to use them to correct the pattern before it drains cash or hurts customers.
The Core Accuracy Metrics You Need to Know
Not all metrics are created equal. Some reveal truth. Others hide it.
Not every accuracy metric tells the same story. Some highlight large misses. Some show bias. Some help you compare across items. And others completely fall apart when volume is low.
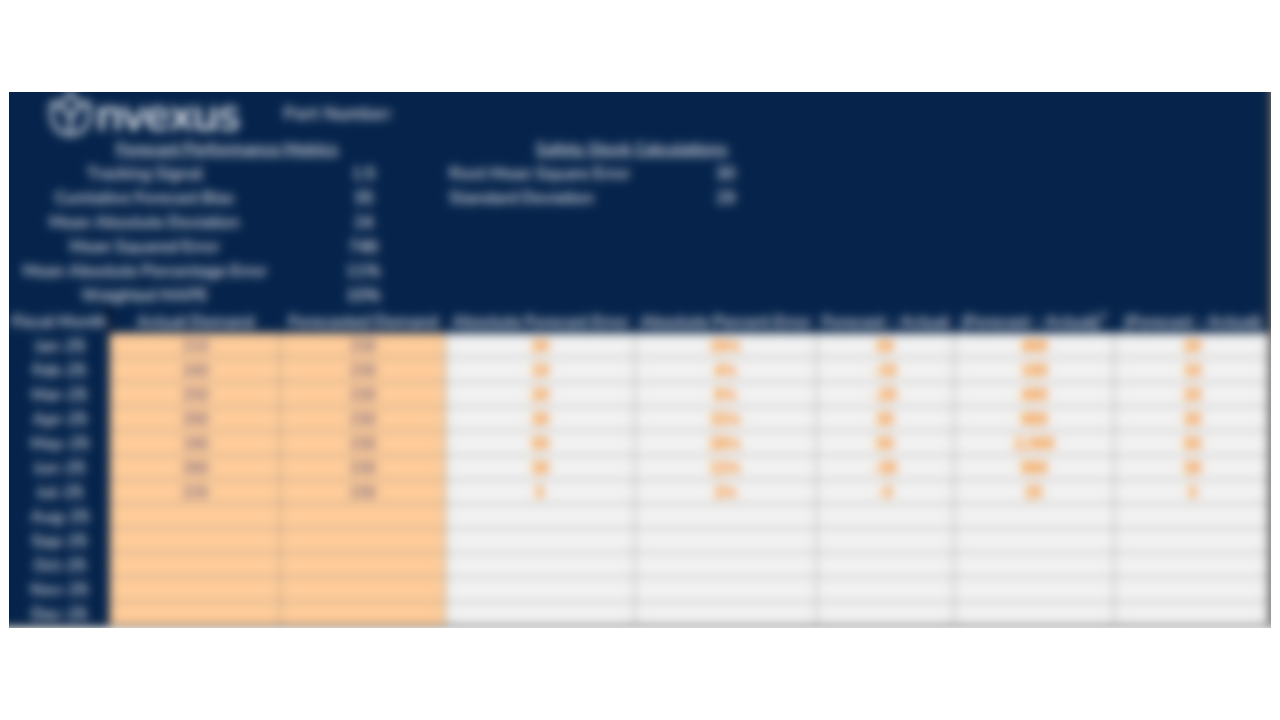
This calculator breaks down the exact formulas your team needs—Tracking Signal, Cumulative Forecast Bias, MAD, MSE, MAPE, and WMAPE—so you know what each metric means, why it matters, and when it’s the right tool for the job.
Below is a quick overview of each measure and how to interpret it in real planning work:
1. Tracking Signal
What It Measures:
Whether your forecast is drifting consistently high or low over time.
Why It Matters:
It’s the fastest way to detect forecast bias. A Tracking Signal outside ±4 shows the forecast has a pattern—not random error—and needs adjustment.
Best Time to Use:
Use Tracking Signal whenever you want to monitor forecast stability and catch directional drift before it becomes a financial problem.
2. Cumulative Forecast Bias
What It Measures:
Total over-forecasting or under-forecasting across a period.
Why It Matters:
While accuracy shows size of error, bias shows direction, which directly ties to cash impact. Cumulative bias tells you exactly how much your forecast steered the business wrong.
Best Time to Use:
Monthly or quarterly reviews to understand how forecast decisions affected cash, inventory, and service levels.
3. Mean Absolute Deviation (MAD)
What It Measures:
The average size of your forecast error in units.
Why It Matters:
MAD is simple and stable. It shows how “off” your forecast is on an average period. Great for planners because it’s intuitive and not distorted by extreme values.
Best Time to Use:
Use MAD when comparing SKUs with similar volumes or when you want a clean, unit-level view of error.
4. Mean Squared Error (MSE)
What It Measures:
The squared average of forecast errors—penalizing large misses heavily.
Why It Matters:
Because it squares the error, MSE highlights big mistakes. Perfect for items where a single bad forecast is costly or disruptive.
Best Time to Use:
Use MSE when large forecast errors carry large operational or financial penalties — which is exactly the case for capacity planning and long-lead items.
5. Mean Absolute Percentage Error (MAPE)
What It Measures:
Forecast accuracy as a percentage of actual demand.
Why It Matters:
MAPE is easy to understand and compare—but it struggles with low-volume items. Even a small error becomes a huge percentage.
Best Time to Use:
Use MAPE only when demand is stable and non-zero. Avoid it for slow movers or intermittent demand.
6. Weighted Mean Absolute Percentage Error (WMAPE)
What It Measures:
Total absolute error divided by total actual demand—weighted by volume.
Why It Matters:
WMAPE removes MAPE’s weaknesses and is far more accurate for reporting. It gives large-volume items the weight they deserve and prevents small SKUs from distorting results.
Best Time to Use:
Use WMAPE for executive dashboards, S&OP meetings, and overall forecast performance. It is the most reliable accuracy metric for business-wide reporting.
Clear definitions. Clear formulas. Clear interpretation.
This calculator helps you pick the right metric for the right problem—so your forecast accuracy reflects reality, not noise.
How to Choose the Right Accuracy Formula
Different planning problems need different accuracy metrics.
There’s no universal forecast accuracy metric. Each formula highlights a different part of the problem—and choosing the wrong one leads to bad planning decisions, unnecessary safety stock, and wasted cash.
The right metric depends on what you’re trying to manage: volume, volatility, risk, service levels, or financial exposure.
Here’s how to choose the right one for the job:
Use MAD when you need a clean, simple view of typical error.
MAD shows the average miss in units, making it perfect for planners who want to see how far off they are on a normal day.
- Best for: everyday operational planning
- Avoid if: comparing items across very different volumes
Use MSE when large misses matter more than small ones.
MSE penalizes big errors, which is exactly what you need for capacity, long-lead items, and items with high operational cost.
- Best for: capacity planning, long-lead items, critical components
- Avoid if: you only care about average performance, not outliers
Use MAPE only when demand is stable and above zero.
MAPE gives a clear percentage accuracy—but it breaks down with small volumes or intermittent demand.
- Best for: smooth, high-volume items
- Avoid if: demand is lumpy, zero, or infrequent
Use WMAPE when you want reliable accuracy across an entire product catalog.
WMAPE is the most dependable percentage-based metric because it weights error by volume.
- Best for: executive dashboards, S&OP, cross-SKU comparisons
- Avoid if: you need to understand direction (bias), not magnitude
Use Tracking Signal to detect forecast bias before it becomes expensive.
Tracking Signal alerts you when your bias is drifting consistently high or low.
- Best for: monitoring bias, early warning systems, exception warning
- Avoid if: you want to measure size of error rather than direction
Use Cumulative Forecast Bias to understand the cash impact of bad forecasting.
Cumulative bias shows how much inventory or revenue you gained or lost due to consistent over- or under-forecasting.
- Best for: financial reviews, inventory audits, root-cause analysis
- Avoid if: you want a per-period performance score
If you want cleaner reporting, use WMAPE.
If you want clearer planning signals, use MAD or MSE.
If you want to fix the root cause, track Bias and Tracking Signal.
The right metric isn’t the one that looks best—it’s the one that helps you plan better
FAQs
What is forecast accuracy?
Forecast accuracy measures how close your forecast was to actual demand. It shows the size of your error.
What is forecast bias?
Bias shows if you consistently over-forecast or under-forecast. It is the direction—not the size—of your error.
What is MAD?
MAD (Mean Absolute Deviation) measures the average absolute difference between forecast and actual. It is simple and easy to explain.
Why is MAPE sometimes misleading?
MAPE inflates errors when actual demand is low. It can make good forecasts look worse than they are.
What is WMAPE?
WMAPE weights errors by actual volume. It is the most reliable accuracy metric for dashboards and S&OP.
What is a Tracking Signal?
Tracking Signal compares cumulative bias to average error (MAD). It shows if your forecast is drifting consistently in one direction.
Which accuracy formula should I use?
Use WMAPE for reporting, MAD for diagnostics, and Tracking Signal for bias control.
How often should forecast accuracy be measured?
Most teams measure it weekly or monthly. Items with volatile demand may need daily tracking.
Can ERP systems calculate forecast accuracy automatically?
Some can, but most require manual setup. This calculator assists with these calculations.
How do I improve forecast accuracy?
Measure bias, track drift, use the right formulas, and clean master data. Accuracy improves when your inputs stay aligned with reality.