

Turn Your Commercial Strategy Into Reliable Material Readiness
Align how you sell with how you buy, build, and stock — so you can hit customer lead times and your cash targets, without guessing at inventory.
A Practical Guide to Matching Customer Lead Times With Your Supply Chain
This free guide walks through Make-to-Stock, Assemble-to-Order/Postponement, Make-to-Order, and Engineer-to-Order — and shows how each strategy impacts inventory, forecast accuracy, and working capital.
You’ll learn how to find your decoupling point, size “material at risk,” and use demand forecast accuracy to protect both service levels and cash.
Get a step-by-step playbook for connecting your commercialization strategy to real-world material plans.
See concrete examples for Make-to-Stock and Postponement, with multiple scenarios.
Walk away with a framework you can use in your next S&OP, capacity, or capital planning review.
Download the Guide
Bridge the Gap Between Strategy and Material Readiness
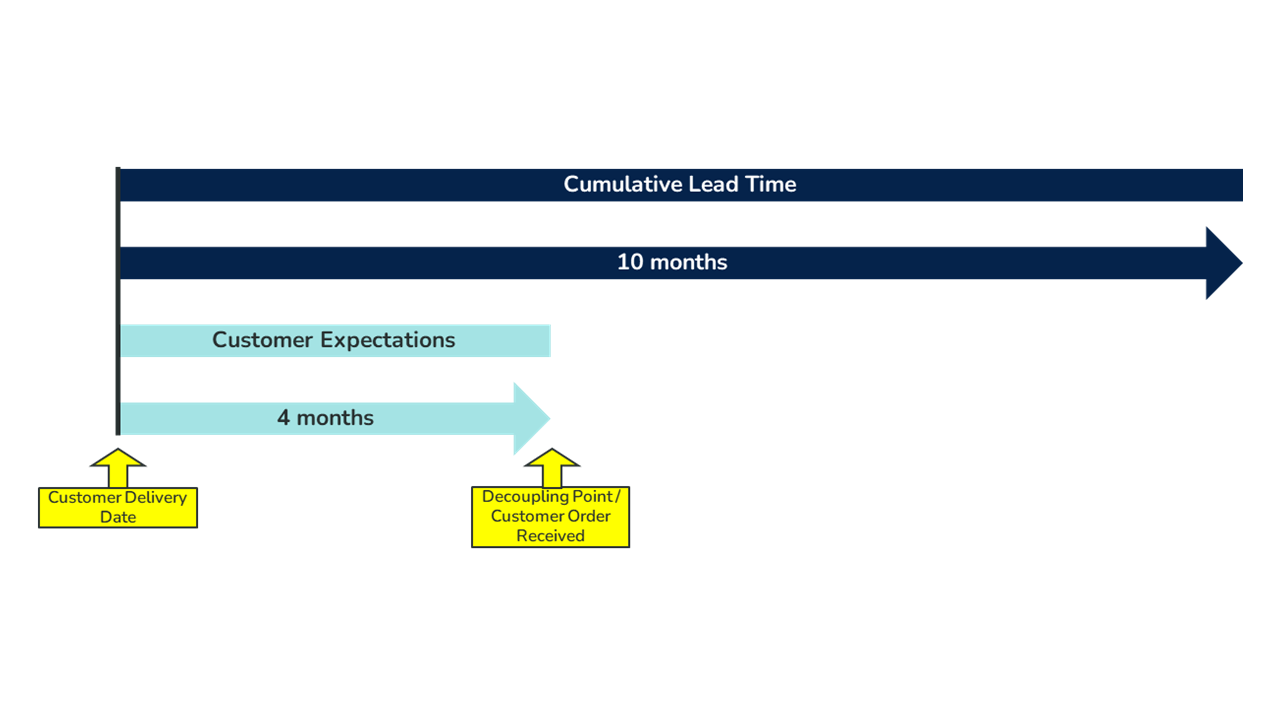
When Your Commercial Strategy and Supply Chain Don’t Match, Everything Feels Hard
If customers want “Amazon Prime-like” lead times but your cumulative lead time is closer to 10 months, you’re running a constant trade-off between speed, cash, and risk.
This guide shows you how to see that gap clearly — and how to close it with better strategy, better planning, and better tooling.
Most teams treat commercialization strategy and material planning as separate discussions. Sales commits to a lead time; operations quietly figures out how to make it work.
This guide brings those conversations together. You’ll see how your manufacturing environment, decoupling point, Advanced Material Planning (AMP), and forecast accuracy all connect — and how they roll up to revenue, profit, and cash.
What You’ll Learn
- Why Your Commercial Promise Outruns Your Lead Times
- Choosing a Manufacturing Playbook That Your Supply Chain Can Support
- The One Decision That Locks In Lead Time and Inventory: Your Decoupling Point
- Advanced Material Planning: Where Strategy Meets Material Risk
- Forecast Accuracy: The Single Number That Drives Both Service and Cash
- The Hidden Price Tag of Bad Forecasts (and the Safety Stock You Need to Cover Them)
- How Nvexus Turns These Concepts Into a Repeatable System
Why Your Commercial Promise Outruns Your Lead Times
When customer lead times shrink but cumulative lead times don’t, your business starts living in the gap. The gap between what you promise and what your supply chain can deliver.
Most customers expect short, predictable lead times. Your ERP system, suppliers, and production routes may tell a very different story. For many products, it can take 8–10 months to buy, build, and ship — even when customers only give you weeks to deliver.
That mismatch is more than a planning headache. It’s a strategic decision zone: how far ahead will you invest in materials and production before orders are real? Invest too early and you’re sitting on excess inventory and write-offs. Invest too late and you miss revenue and disappoint customers.
This guide helps you see that “Commercial Strategy Gap” clearly so you can decide, on purpose, where to take risk, where to hold inventory, and how to protect both on-time delivery and working capital.
Choosing a Manufacturing Playbook That Your Supply Chain Can Support
Your Manufacturing Environment Dictates Your Inventory, Not the Other Way Around
You can’t run an Amazon-style promise on an Make-to-Order supply chain — at least not without paying for it somewhere.
The type of manufacturing environment you operate in — Make-to-Stock, Assemble-to-Order/Postponement, Make-to-Order, or Engineer-to-Order — quietly controls how you plan, where you hold inventory, and how responsive you can be.
This guide walks through each environment and shows:
- What kind of demand signals you rely on (forecasts, configurations, or one-off specs)
- What planning behavior you need from your ERP and your teams
- How much inventory investment each model requires to stay credible with customers
You’ll see a clear, side-by-side view of each strategy so you can identify where you are today and what needs to change if you want to shift your lead times, margins, or capital profile.
The One Decision That Locks In Lead Time and Inventory: Your Decoupling Point
Where you switch from forecast-driven to order-driven work determines how fast you can deliver — and how much you have to pre-build.
The decoupling point (or order penetration point) is where you stop pushing product based on forecast and start pulling based on actual orders. Upstream of that point, everything is a bet on the future. Downstream, everything is a response to reality.
This guide shows where the decoupling point usually sits for each environment — MTS, ATO/Postponement, MTO, and ETO — with real product and company examples. You’ll see how shifting that point even a few months closer to the customer can cut “material at risk” dramatically, but may increase lead times or reduce flexibility.
The goal isn’t to copy someone else’s model. It’s to pick a decoupling point that matches your market, your margin structure, and your appetite for inventory risk — and then plan around it deliberately.
Advanced Material Planning: Where Strategy Meets Material Risk
Advanced Material Planning sits in the space between your total cumulative lead time and the lead time your customers will tolerate.
Advanced Material Planning (AMP) is about one thing: managing the gap between how long it actually takes to get a product ready and how long your market is willing to wait.
If your cumulative lead time is 10 months and customers expect delivery in 3, you have a 7-month window where you must decide what to buy, what to build, and where to hold inventory.
The guide explains how AMP helps you decide which components deserve early investment and which should stay flexible based on lead time and price. It also shows how poor choices in this window show up later as excess inventory, expedited freight, or missed revenue.
Nvexus supports this work with a Cumulative Lead Time calculator that walks your entire BOM — so your AMP decisions are based on real structure and real data, not guesswork.
Forecast Accuracy: The Single Number That Drives Both Service and Cash
It’s not just “What will we sell?” — it’s “How wrong can we afford to be?”
Every AMP decision depends on how much you trust your demand signal. Forecast accuracy is what connects customer demand, inventory, and cash. When forecasts are tight, you can commit earlier with less risk. When they’re noisy, every month of lead time multiplies the cost of being wrong.
This guide covers six core forecast metrics — Tracking Signal, Cumulative Forecast Bias, MAD, MSE, MAPE, and WMAPE — with plain-language definitions, why they matter, and the formulas behind them. If you want to measure these consistently across your team, the companion Demand Forecast Accuracy Calculator gives you a standardized way to calculate and compare results.
The goal isn’t perfection. It’s understanding your current level of forecast accuracy, spotting where large errors or bias are coming from, and improving over time. Small, steady gains in accuracy compound into better service, lower inventory risk, and smarter material decisions — progress over perfection.
The Hidden Price Tag of Bad Forecasts (and the Safety Stock You Need to Cover Them)
Bad Forecasts Don’t Just Hurt Service — They Quietly Tax Your P&L and Balance Sheet
You pay for forecast error twice: once in missed sales, and again in inventory you shouldn’t have bought.
Under-forecast, and you stock out. You miss revenue, frustrate customers, and open the door for competitors who can deliver faster. Over-forecast, and you tie up cash in inventory that sits in a warehouse, goes obsolete, or gets discounted at the end of the quarter.
Safety stock is the buffer that protects you from these swings. This guide explains how standard deviation and RMSE feed into the most common safety stock formulas — and how your target service level translates directly into inventory dollars. If you want a consistent way to size these buffers for these forecasted components and subassemblies, the Nvexus Safety Stock Calculator makes it easy to calculate and compare values based on both your forecast accuracy and dependent-demand behavior in your ERP.
The goal isn’t to eliminate forecast error — that’s impossible. The goal is to reduce bias, improve accuracy over time, and use the Safety Stock Calculator to right-size your buffers while you get there.
Better accuracy means less insurance you need to carry, more cash released from inventory, and greater confidence that you have the right parts ready when customers place their orders.
How Nvexus Turns These Concepts Into a Repeatable System
From One-Off Analysis to an Always-On Material Readiness Engine
The guide gives you the framework. Nvexus helps you run it every day.
It’s one thing to map cumulative lead time and material risk in a slide deck. It’s another to keep that view current across thousands of parts, changing BOMs, and shifting demand patterns.
Nvexus helps by:
- Calculating cumulative lead time across the full BOM with precise control over phantom items, “buy under buy,” and component-level rollups.
- Providing a dependent-demand safety stock calculator so planners can size buffers using real statistical behavior from your ERP.
- Recommending the right order policy and planning parameters for every item — powered by live ABC/XYZ classification, EOQ/POQ logic, Reorder Point calculations, safety stock recommendations, and parameter-drift detection to keep each SKU aligned to your business model. (For a deeper dive into these methods, see our Order Policy Playbook.)
- Supporting planners with intelligent workflows — role-based tasks, exception monitoring, and alerts that keep teams focused on the few items that truly matter.
You still own the strategy — Make-to-Stock, Assemble-to-Order/Postponement, Make-to-Order, or Engineer-to-Order. Nvexus gives you the visibility, safeguards, and decision support needed to keep that strategy alive inside your ERP and your day-to-day planning.
FAQs
What is “Commercialization Strategy – Material Readiness”?
It’s the alignment between how you plan to sell (lead times, promises, offerings) and how ready your supply chain is to support those promises with real material, capacity, and inventory.
What is a decoupling point, in simple terms?
It’s the point in your process where work stops being based on forecasts and starts being based on actual customer orders — the line between inventory risk and customer responsiveness.
Why does cumulative lead time matter so much?
Because it tells you how far ahead you have to commit material and capacity before a customer order exists. The longer it is, the more exposed you are to forecast error and demand shifts.
How is this different from just running ERP planning?
ERP will create planned orders based on current settings and demand inputs, but it doesn’t tell you if your business strategy, decoupling point, and material readiness are aligned — or how much “material at risk” and forecast error you’re carrying.
Why is forecast accuracy more important in Make to Stock and Postponement models?
In those models, you commit material before demand is confirmed. Every point of inaccuracy multiplies across months of lead time, turning small forecast errors into big inventory or stockout problems.
If I had perfect forecast accuracy, would I still need safety stock?
For demand coverage, no — perfect accuracy would mean no demand-driven safety stock. In reality, you still may hold some buffer for supply issues, minimum order quantities, or production variability.
How does postponement help reduce risk?
Postponement moves the decoupling point closer to the customer, so you delay final configuration or build until you’re closer to real orders. That shortens the window where you’re exposed to forecast error and reduces material at risk.
Can Nvexus calculate independent demand safety stock automatically?
Nvexus focuses on dependent-demand safety stock (components driven by parent demand in the ERP). Independent demand safety stock for finished goods is not fully automated because forecast consumption and timing rules can vary widely across systems and businesses.
How do I know which manufacturing strategy is right for my business?
Start with your customer expectations and product characteristics, then look at your cumulative lead times and capital constraints. The guide gives you a structured way to compare Make to Stock, Postponement, Make to Order, and Engineer to Order, and see which combination matches your market and your balance sheet.